Multimodal Sensor Array System (MSAS)
Wearable for Hemodialysis Patients
_edited_edited.png)
Virginia Tech Biomedical Engineering Capstone Project
August 2021-May 2022

Problem Statement
The MSAS wearable sensing device will track a
variety of parameters and have an accompanying app/monitor interface. The sensor data will be
displayed in a simplistic and digestible format to improve the patient experience by making information about their treatment meaningful and accessible to them.
This device aims to provide more accurate real-time biofeedback data so that clinicians will be able to accurately prescribe dialysis treatment. The wearable and app solution will hopefully create a more personalized
system to manage therapy.
Clinical Background Research
More than 660,000 people suffer from kidney failure in the United States alone, and of those 660,000 people, nearly 470,000 are on some form of dialysis [1]. Dialysis requires patients to perform multiple blood tests on a recurring basis in order to assess the efficiency of the treatment [2]. These blood tests allow specialists to determine the amount of electrolytes within the body, measure cholesterol and blood sugar, and observe waste management of the dialyzer. Receiving test results in a gradual fashion causes a delayed response to urgent matters such as diabetes and heart disease, the former being the leading cause of death among people on dialysis [3]. The current methods of prescribing dialysis treatment are based on estimations of patients’ fluid content and infrequent measures of blood content.
It is crucial to receive such vitals in a prompt manner so that physicians can diagnose and treat such issues.
User Research
Our team conducted extensive user research with key stakeholders so that we could derive user needs that would guide our design process.
Concept Generation
Click each picture to learn more about the design.

Final Design Selection
After weighing the pros and cons of each design using a Pugh matrix, we determined that a leg sleeve would be the optimal design. At this point, individual team members took charge of independently leading components of the design research to meet our deadlines.
Sensor Selection
-
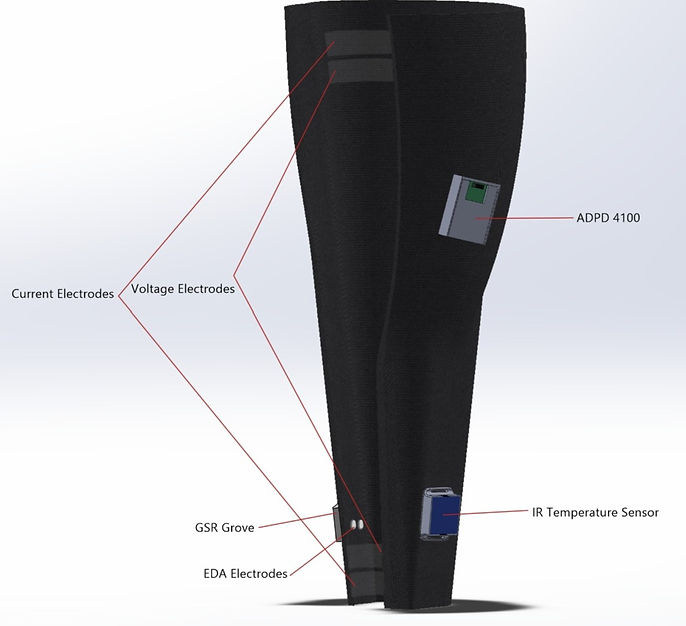
Electrodermal Activity (EDA) sensors: measures skin conductivity to understand changes in emotional and cognitive states.
-
Bioimpedance sensors: measures the relationship between fluid and cell mass, which is an important indicator for fluid overload, edema development, and nutritional health
-
Thermistor sensor: provides constant monitoring of body temperature to alert clinicians if an infection is on the rise.
-
Photoplethysmography sensor: a noninvasive method for detecting blood volume changes. and provides measures of heart rate, heart rate variability, oxygen saturation, and blood pressure.

Personal Contribution 1.0:
EDA Research, Validation, and Verification Testing
Skills Used:
-
Microcontroller prototyping
-
Sensor data acquisition
-
Signal processing
-
Statistical Analysis
-
Experimental design
-
MATLAB
-
R
-
I conducted repeated trials comparing the GSR Grove, an off-the-shelf EDA sensor (Fig. 1), to the Empatica E4, an FDA-approved EDA sensing wearable(Fig. 2).
-
Each test participant wore the Empatica E4 on their dominant wrist and I sewed the GSR Grove electrodes into the inside of a prototype compression leg sleeve close to the ankle. The sensors were worn for 3 minutes at a time.
-
I wrote a MATLAB algorithm to adjust the GSR data to fit on the same scale as the Empatica conductance values, and to signal process the data.
-
After gathering data from many test participants, I used R to conduct a statistcal analysis.

Fig. 1 GSR Grove EDA Sensor

Fig 2. Empatica E4
.png)
Fig. 3 Example data set showing simulatenous data collection from GSR Grove and Empatica E4. An upward trend in skin conductance data can be correlated to higher levels of stress.
Results:
The correlation values were calculated for each trial to compare the strength of the relationship between the GSR Grove data and Empatica E4. The majority of the trials provided strong relationships between the two sensors and the general trends of the data followed the trend outputted from the Empatica E4. However, the actual numerical values outputted from the GSR Grove do not pass the target specification of having <= 5% error between the two measurements.
Future research will involve adding a correction factor in the algorithm to calculate accurate EDA measurements from the ankle measurements.
App UX/UI
Personal Contribution 2.0:
Skills Used:
-
Wireframing
-
Figma
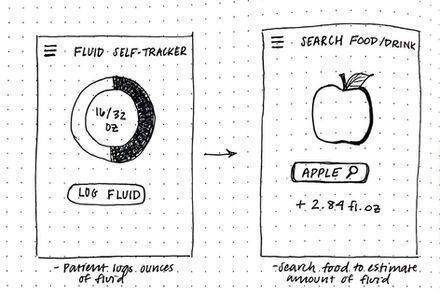
I designed an app interface with the primary goal of providing meaningful data and educational information to the patient.
Primary Features:
-
Informs the user of their fluid levels, heart rate and blood pressure, temperature changes, and stress levels.
-
Interactive design allowing the user to input their daily fluid intake, which is a key component of dialysis management. This would keep the patient informed on how much fluid is entering their body through certain foods to keep them on a target volume.
-
Alert system when sensor readings reach levels that are higher than the patient's baseline and correlate with morbidities based on research findings.
-
The app could be linked with the patient’s physician to alert them to troubling readings.

.jpg)

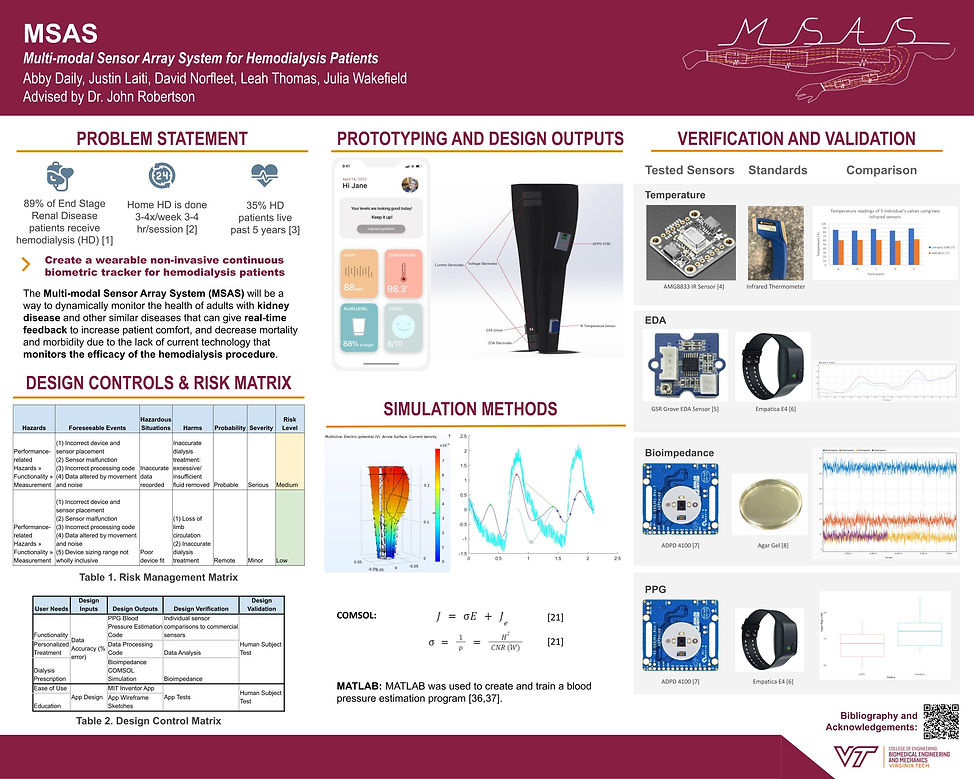
Final Poster for
Capstone Research Symposium

Research Citations:
[1] "Kidney Disease Statistics for the United States." National Institute of Diabetes and Digestive and Kidney Diseases (NIDDK). https://www.niddk.nih.gov/health-information/health-statistics/kidney-disease
[2] C. Corr, A “New Normal”: Life on Dialysis- The First 90 Days. National Kidney Foundation (n.d).
[3] J. D. Harnett, R. N. Foley, G. M. Kent, P. E. Barre, D. Murray, and P. S. Parfrey, “Congestive heart failure in dialysis patients: prevalence, incidence, prognosis and risk factors,” Kidney international, Mar-1995. [Online]. Available: https://pubmed.ncbi.nlm.nih.gov/7752588/.


.png)

.png)
.png)
.png)
.png)